Your cloud native empire will never have looked so beautiful…
In my last article, I mentioned an open-source platform called Prometheus. Now if you are in any way involved with the cloud native ecosystem, you will probably have come across it. After all, it shares its name with a Greek Titan that starred in one of the world famous ‘Alien’ movies 👽. But then I tell you that it is a monitoring and alerting toolkit that includes data scraping and storing, it’s own querying language called ‘PromQL’ and a built in alert manager. Yes, that sounds great… but… what does that mean? Well here we go again!

Prometheus… 🤷♂️
Now let’s build ourselves a scenario. You’re like me, and you’ve just set up your first all singing, all dancing kubernetes cluster on GKE 🎵. Whether you know it or not (I definitely didn’t to begin with), this is a very simple, turnkey experience. What I mean by this is that from go, a lot of the clusters components are setup for you, and their presence just fades into the background (within the darkest depths of the Google Cloud Platform 👻).
You think to yourself, “I wonder how my cluster is performing… What pods are using up the most memory, how much traffic am I getting through my contour ingress controller?”. Well.. that certainly is an interesting question. You have a scroll through the GCP web UI and the built in functions just throw it into your lap and you don’t need to spare a second thought. But… where are those metrics really coming from? and if you hadn’t asked yourself this question… and then spun up something more vanilla afterwards, like Kubeadm; why aren’t these same capabilities just given to to me in the same way? Now we’re talking 🕵🏻♂️.

Prometheus is a set of tools that you’ll want to get for a thorough logging and monitoring experience on many container orchestrators. And what makes it so widely acclaimed? Well, a couple of things. First of all it has a powerfully simple querying language, so it’s users can analyse their Kubernetes, Docker Swarm, Apache Mesos, Cloud Foundry… or just Kubernetes 🙃 clusters down to the minute details with ease.
Whats more? Prometheus was the second project to be officially supported by the Cloud Native Computing Foundation, along with Kubernetes and Envoy (mentioned in the first article for this blog, take a look). This support gives a company that plans to integrate its applications with Prometheus tooling, the assurance that it will be an industry standard going into the future. For this reason, this makes it a perfect candidate for a metrics provider, and it has seen wide spread adoption; with people speculating that the number of organisations using it could be in the tens of thousands.
So how is all of this possible?
So as I said in the previous section, Prometheus is far more than a Kubernetes concept. It doesn’t stipulate on the application running, and it has the capability of using metrics on almost any application provided it is configured correctly. In general, it requires that the workload provides the metrics for it using two components:
- Prometheus Exporter: These are libraries and servers that do the job of exporting the metrics generated by applications/services in your environment as Prometheus friendly metrics 😊
- Prometheus HTTP Endpoint: The exporter then sends these metrics to a HTTP endpoint, which is a port on the applications http address that sits open, providing the metrics that Prometheus requires for the amazing stuff it’ll do later on.
Ok, so how does Prometheus get hold of these metrics that are now spilling out of the configured port? Well, Prometheus has a server application conveniently named ‘Prometheus Server’, that ‘scrapes’ up the metrics sitting on the aforementioned ports, organises them into a time series database (TSDB), and throws it into a storage volume somewhere, amazing

But I thought you said there was an alert manager?
Oh yes, you’re right there. Prometheus does indeed have its own dedicated alert manager. Embedded within the Prometheus server are capabilities that allow the user to define alerting rules based on the metrics provide by the cluster. For instance, want to know when there is high request latency for a web page on your server? No problem. This can be done easily if you give the server a correctly configured alert rules yaml. For example:
groups:
- name: example
  rules:
  - alert: HighRequestLatency
    expr: job:request_latency_seconds:mean5m{job="myjob"} > 0.5
    for: 10m
    labels:
      severity: page
    annotations:
      summary: High request latency
Wow, markdown makes putting yaml in a web article super easy 🆒. Anyway, where was I… ah yes.
Once this has been deployed to the prometheus server, any metrics that meet these alert conditions will send the relevant alert to the manager. The alert manager can be reached easily through a web ui, where you can view all the alerts sent from the server, or there is something jazzy called the Alertmanager webhook receiver 😲. What does this mean? well it means you can have your alerts delivered to a service of your choice. such as? well, you name it; they do it. SMS, Email, Telegram, Slack, Microsoft Teams, ServiceNow, Zoom, Alibaba Dingtalk, Rocket Chat (looks so awesome). The list goes on. Now you truly can make yourself feel like you have your own starship enterprise.

PromQL… Where the real fun begins 🕺
As I mentioned, the Alertmanager does have it’s own dedicated web-ui, and so does the Prometheus server. When you access the Prometheus web-ui (through a default port of 9090), you’re faced with a pretty simple, yet bland looking interface. It has a simple text input box labelled ‘Expression’, with a button below it that says ‘Execute’. Very exciting, let’s start playing.
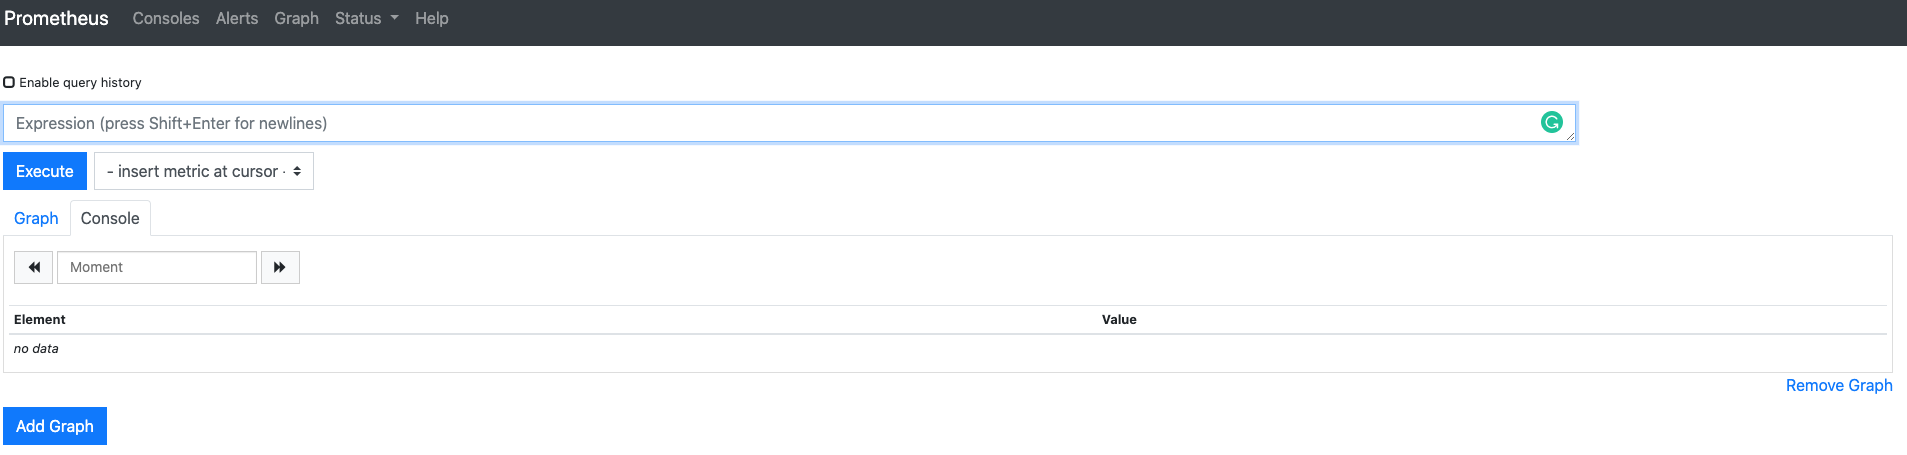
So by ‘Expression’, Prometheus means that it intends for the user to input syntax that ‘queries’ for some metrics sitting on the Prometheus Database (TSDB). This will be your way of telling prometheus, “hey, fetch me the CPU utilisation data of all the containers running on my kubernetes cluster, and return it organised in a certain way. Then finally if all goes well, it’ll plot that data in the graph box sat below in the GUI. But just like a any extraterrestrial being, you must ask yourself ‘what language does it speak?’. Well thankfully, it isn’t Clingon. In fact, its querying language, PromSQL, is one of the reasons why this tool has found such popularity. As you can see below, the syntax is actually very simple to understand.. a.k.a it’s pretty much in plain english, hoorah! If you haven’t deduced already, this example fetches the amount of http GET requests taking place in the staging, testing and development environments… easy 😂.
http_requests_total{environment=~"staging|testing|development",method!="GET"}
But I was hoping for something prettier 💋
Well to be honest… so was I. But don’t worry, I have good news!
It’s time for another mystical platform name into the mix… it’s slick, it’s shiny, it’s…

I know right?

So welcome to the magical land of Grafana. Where you can make use of PromSQL and the prometheus server APIs to visualise your generated metrics on highly configurable dashboards. That’s right, we’ve just taken your Starship Enterprise to the next level 🛰. Each dashboard consists of one or more panels that can be arranged into rows. Of course usually each panel on the dashboard is related to each other. So you would have for instance a dashboard of panels for information regarding your kubernetes clusters CPU/Mem/Disk utilisation, and another dashboard that displays the ingresses of your applications sitting within the cluster. Then you could even have another dashboard that showed the geographical location of each request to your site in real time… yes I absolutely need to look into doing it for this site 🙌. The sky really is the limit… if it’s data that can be hoovered up by prometheus into the database, it can be visualised on Grafana with some configuration. And what’s even cooler? You can make specific dashboards public so that you can show them to friends… or uh… colleagues easily. Don’t worry though, you will still have full access to your precious infrastructure under lock and key.
I hear you, I hear you, you want to see what this interface looks like in real life. Well good news! Thanks to the open-source attitude some organisations take towards these platforms, certain dashboards are available for anyone to look at. For instance, CERN, CNCF, the Beehive Project and many more make some of their dashboards fully accessible for the world to see. I’ve just wasted the last 30 minutes looking around them and they’re amazing, so feel free to give them a look if you have any more free time.
I’m sold, i’m sold! How do I get it on my Kubernetes cluster?
How do you get it? Well that’s maybe even better than the joys of the previous section. This github repository named kube-prometheus is all you need to get yourself started with your very own Prometheus server, web UI, AlertManager, and even Grafana, to start viewing your empire like a king on day 0. I used it on GKE, and it was super easy to get going. In fact I feel this task was when things started to click in my head about kubernetes as a platform, which was very rewarding.
‘Scraping’ up the last bits and pieces
So that’s it. We’ve gained some clarity on yet another cloud native tool, and taken a shallow dive into what is possible when Kubernetes teams up with Kubernetes and Grafana to give nerds like myself a full view of their estate; but also a window view for anyone else interested. For any organisation running Kubernetes or a cloud-native platform like it, these tools really are a no brainer… they are the industry standard… and well… why wouldn’t you want to have what I just showed you? It’s so awesome!
I’ll leave you with another Youtube video, as this tends to be the standard way to finish these articles. Tom Wilkie, one of the Prometheus Developers, gave a great talk back in 2018, which gives a more thorough and detailed tour of the Prometheus world, and how that can be linked up with Grafana. So I hope you enjoyed this weeks instalment, and as always any feedback at all is more than welcome.